
How to Handle Missing Data: Complete Guide & Python Methods
Missing data handling is a foundational step in data cleaning and machine learning preparation. To deal with missing data effectively, data scientists evaluate whether entries are missing completely at random (MCAR), missing at random (MAR), or missing not at random (MNAR), then apply deletion, statistical mean/median imputation, or machine learning algorithms like K-Nearest Neighbors (KNN) in Python.
 Figure 1: Data cleaning pipeline identifying null values and applying domain-appropriate imputation techniques.
If missing data accounts for less than 5% of rows and is un-correlated with key features, use row deletion (df.dropna()). For missingness between 5% and 30% in continuous features, use median imputation for skewed data or KNN imputation for correlated variables. If a column has over 60% missing entries, consider dropping the column or creating an explicit Missing indicator category. Always analyze null distributions first using tools like DataFrog Data Profiler or DataFrog CSV Analyzer before training models.
Table of Contents
- Understanding Missing Data & Why It Matters
- The 3 Missing Data Mechanisms: MCAR, MAR, and MNAR
- Method 1: Deletion Techniques (Listwise & Pairwise)
- Method 2: Statistical Imputation (Mean, Median, & Mode)
- Method 3: Advanced Machine Learning Imputation (KNN & MICE)
- Handling Missing Categorical Data
- Handling Missing Data in Python (Pandas & Scikit-Learn Code)
- Method Comparison: Choosing the Right Strategy
- Common Pitfalls & Mistakes to Avoid
- Frequently Asked Questions (FAQ)
Understanding Missing Data & Why It Matters
In real-world data collection, datasets frequently contain empty entries, NaN flags, null values, or placeholder text such as N/A or -999. Missing data occurs due to un-recorded sensor readings, optional user survey fields, software integration glitches, or system timeouts.
Failing to properly treat missing values introduces serious analytical problems:
- Algorithm Failures: Scikit-learn estimators (such as Logistic Regression, Support Vector Machines, and Neural Networks) raise
ValueError: Input contains NaNand crash when fit on unhandled null entries. - Statistical Skew: Simply ignoring or naively dropping missing entries reduces sample size, inflates standard errors, and distorts confidence intervals.
- Systematic Bias: If missingness correlates with demographic or operational attributes (for example, high-income respondents skipping income fields), deleting missing rows distorts sample representativeness.
The 3 Missing Data Mechanisms: MCAR, MAR, and MNAR
Before selecting an imputation technique, determine the mathematical relationship governing missing entries.
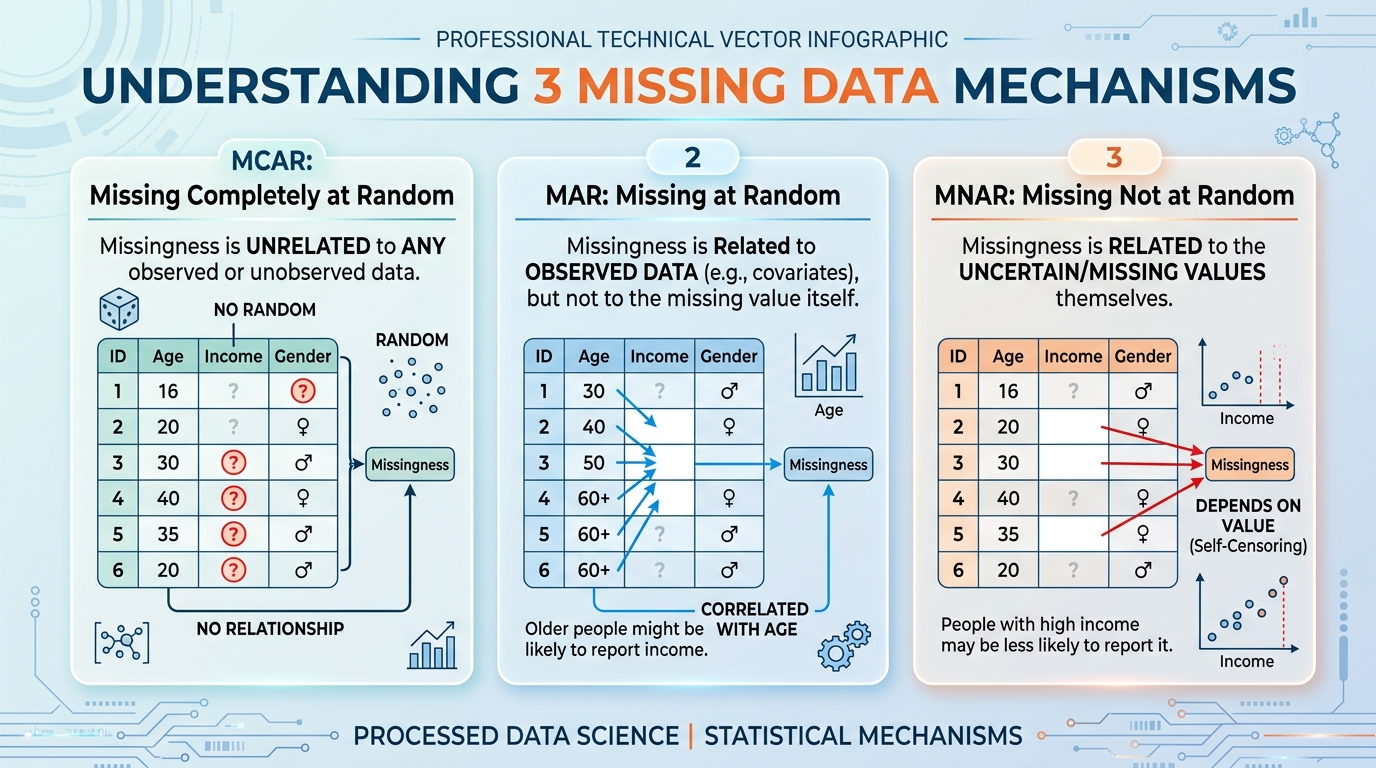 Figure 2: The three statistical missingness mechanisms: Missing Completely at Random, Missing at Random, and Missing Not at Random.
1. Missing Completely at Random (MCAR)
Missingness is completely independent of both observed and unobserved variables. The probability of an entry being missing is identical across all observations.
- Example: A physical laboratory sensor loses battery power randomly for 10 minutes, skipping data points regardless of temperature or humidity.
- Remedy: Listwise row deletion (dropna) is mathematically unbiased for MCAR data.
2. Missing at Random (MAR)
Missingness is systematically related to observed variables in the dataset, but not to the missing value itself.
- Example: In an e-commerce survey, younger users are less likely to provide a home landline phone number. The missingness depends on observed Age, not the Phone Number itself.
- Remedy: Group-wise median imputation or KNN regression imputation using observed predictors.
3. Missing Not at Random (MNAR)
Missingness depends directly on the unobserved missing values themselves. - Example: Individuals with very high or very low annual incomes deliberately decline to answer income survey questions. - Remedy: Domain-specific modeling, creating explicit missingness indicator features, or pattern mixture models.
Method 1: Deletion Techniques (Listwise & Pairwise)
Deletion removes missing entries entirely from analysis.
Listwise Deletion (Complete Case Analysis)
Listwise deletion drops any row containing one or more missing values across any column. - Best For: Large datasets where total missing rows account for less than 5% of records and missingness is MCAR. - Risk: Dramatically reduces sample size if null entries are scattered across many features.
Feature (Column) Deletion
Column deletion removes an entire attribute from the dataset. - Best For: Non-critical predictor columns where over 60% to 70% of values are missing.
Method 2: Statistical Imputation (Mean, Median, & Mode)
Imputation replaces missing values with estimated replacement numbers.
Mean Imputation
Replaces missing numerical entries with the column average. - Best For: Symmetric, normally distributed continuous features. - Warning: Reduces feature variance and weakens covariance with other attributes.
Median Imputation
Replaces missing numerical entries with the column median. - Best For: Skewed numerical data containing extreme outliers (such as income or housing prices).
Mode Imputation
Replaces missing entries with the most frequently occurring value. - Best For: Nominal or ordinal categorical variables with low missingness.
Method 3: Advanced Machine Learning Imputation (KNN & MICE)
Machine learning imputation predicts missing entries by modeling relationships across complete feature sets.
K-Nearest Neighbors (KNN) Imputation
KNN Imputer identifies the $K$ most similar complete records based on distance metrics (Euclidean distance) and computes a weighted average of neighbor values.
# KNN Imputation in scikit-learn
from sklearn.impute import KNNImputer

imputer = KNNImputer(n_neighbors=5)
df_imputed = imputer.fit_transform(df)
MICE (Multivariate Imputation by Chained Equations)
MICE models each feature with missing values as a function of all other features in an iterative round-robin sequence using linear regression or random forests.
Handling Missing Categorical Data
Categorical variables require specific handling strategies:
- Explicit ‘Missing’ Category: Convert
NaNentries to a distinct string label like"Missing"or"Unknown". This preserves missingness as an informative signal for decision trees and XGBoost models. - Mode Replacement: Fill missing categorical entries with the most common string label if null occurrence is minimal (< 2%).
Handling Missing Data in Python (Pandas & Scikit-Learn Code)
Below are practical code recipes for handling missing values in Python using pandas and scikit-learn.
import pandas as pd
import numpy as np
from sklearn.impute import SimpleImputer, KNNImputer

# Load sample dataset
df = pd.DataFrame({
    'Age': [25, 30, np.nan, 45, 38, np.nan],
    'Salary': [50000, 64000, 82000, np.nan, 71000, 58000],
    'Department': ['IT', 'HR', 'IT', 'Finance', np.nan, 'HR']
})

# 1. Inspect Missing Data
print("Missing counts:\n", df.isnull().sum())
print("\nMissing percentage:\n", df.isnull().mean() * 100)

# 2. Median Imputation for Skewed Numerical Feature (Age)
df['Age_filled'] = df['Age'].fillna(df['Age'].median())

# 3. Categorical Fill with Constant Label
df['Department_filled'] = df['Department'].fillna('Missing')

# 4. Scikit-Learn SimpleImputer (Mean Strategy)
num_imputer = SimpleImputer(strategy='mean')
df[['Salary_imputed']] = num_imputer.fit_transform(df[['Salary']])

# 5. Advanced KNN Imputation for Numerical Features
knn_imp = KNNImputer(n_neighbors=2)
df_knn = pd.DataFrame(
    knn_imp.fit_transform(df[['Age_filled', 'Salary_imputed']]),
    columns=['Age', 'Salary']
)

print("\nClean Imputed Dataframe:\n", df_knn.head())
Method Comparison: Choosing the Right Strategy
| Strategy | Best For | Preserves Variance | Risk of Model Bias | Setup Effort |
|---|---|---|---|---|
| Listwise Deletion | MCAR data, < 5% missing rows | ❌ Reduces Sample Size | Low (if MCAR) | Instant (dropna) |
| Mean / Median Imputation | Continuous features, MAR | ❌ Reduces Variance | Medium | Low (fillna) |
| Mode Imputation | Low-missingness categorical data | ❌ Inflates Mode Peak | Medium | Low (fillna) |
| Missing Indicator Label | Categorical features, MNAR | ✅ Preserves Pattern | Low | Low |
| KNN Imputation | Complex correlated features | ✅ High Accuracy | Low | Medium (KNNImputer) |
| MICE / Iterative Imputer | Multi-feature statistical datasets | ✅ Excellent | Very Low | High (IterativeImputer) |
Common Pitfalls & Mistakes to Avoid
- Imputing Target Variable ($y$): Never impute missing entries in your prediction target column. Delete rows where target $y$ is missing.
- Data Leakage: Compute mean, median, or KNN imputer statistics only on the training split (
fit), then transform the test split (transform). Fitting imputers on the whole dataset leaks test distribution information into training data. - Blind Zero-Filling: Replacing null values with
0skews mathematical averages and forces algorithms to treat missing measurements as actual zero quantities.
Frequently Asked Questions (FAQ)
What is the best way to handle missing data in a dataset?
The best method depends on the missingness mechanism. If under 5% of data is missing completely at random (MCAR), listwise deletion is safe. For higher missingness or structured data, use KNN or MICE imputation rather than simple mean replacement.
Why should I avoid replacing missing values with zero?
Replacing missing values with zero introduces artificial numerical skew, distorts standard deviations, and forces models to treat absent measurements as true zero observations.
What are MCAR, MAR, and MNAR in data analysis?
MCAR (Missing Completely at Random) means missingness is entirely un-correlated with any feature. MAR (Missing at Random) means missingness relates to observed variables. MNAR (Missing Not at Random) means missingness depends directly on the unobserved missing values.
How do I check for missing values in Python pandas?
In Python pandas, use df.isnull().sum() to count missing values per column, or df.isnull().mean() * 100 to view the percentage of null entries across your dataframe.
When should I drop a column due to missing values?
Drop a column if more than 60% to 70% of its entries are missing and the feature is non-critical for domain prediction, as imputing excessive missingness introduces heavy synthetic bias.
How do I handle missing categorical data?
For missing categorical variables, replace null entries with a new explicit category string like ‘Missing’ or ‘Unknown’, or impute using the statistical mode if the missing percentage is very low.
Profile and Audit Your Datasets Privately
Before applying imputation or building predictive models, profile your dataset for missing entries and structural errors using DataFrog’s browser-based utilities:
- DataFrog Data Profiler: Profile dataset distributions, count null values, analyze data types, and inspect summary statistics 100% locally.
- DataFrog CSV Analyzer: Parse raw CSV files, detect missing column fields, and analyze data completeness.
- DataFrog Data Dictionary Generator: Generate comprehensive schema documentation and data dictionaries from uploaded datasets.